
【雅思写作从5到7】饼图写作修改
You should spend about 20 minutes on this task.
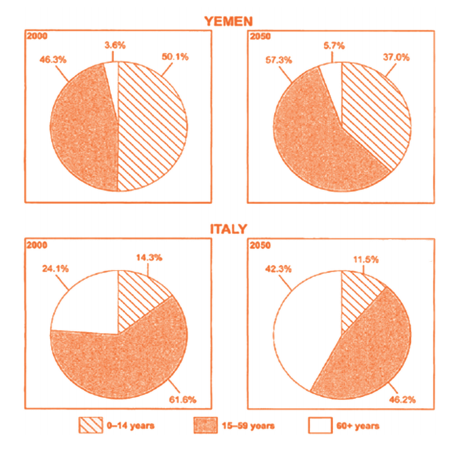
The charts below give information on the ages of the populations of Yemen and Italy in 2000 and projections for 2050.
Summarize the information by selecting and reporting the main features and make comparisons where relevant.
 The pie charts compares(主语是复数,动词要去掉 s)the population of three age groups in Yemen and Italy, and make expectations for 2050(最好在后面加上对总体趋势的概括,按照先总后分、先一般后特殊的顺序进行写作).
Obviously, in Yemen, people under 14 years old constitute the largest proportion with 50.1%. Next comes to(删除,不需要 to)people between 15-59 old with marginally less percentages(46.3%). Only 3.6% people there(are)above 60 years old. people in 15-59 years old and above 60 years old are predicted to meet a significant rise(nearly 20%)and(加 then)a slight one(about 2%)in 2050 respectively. In contrast, it is projected that there would be less young people(under the age of 14), declining by 13%.
Moving to Italy, people in the 15-59 years old were the dominant group, representing 61.6% in 2000, which is expected to decrease dramatically to 46.2% in the next 50 years. In 2000, 24.1% old people(above 60 years old)and 14.2% young people compromised(应该是 composed)the remaining population. In 2050, old are predicted to be on a significant rise by about 18%, while the young experience a moderate decrease by just under 3%.
Overall, despite some predicting(应该是 predicted)changes of the constituting population in different groups, people under 60 years old in Yemen and people above 14 years in Italy should be constantly dominant.
【总体评价】很好,这个小作文写得不错。无论是时态还是总结都把握得很好,句型也不单调。
是 7 分水平的作文。